◤Demonstration – KL-Collaps◢
Main menu:
We will show how to set parameters of KL-Collaps. Assume that KL-Result returned a hypothesis shown in Figure 1.
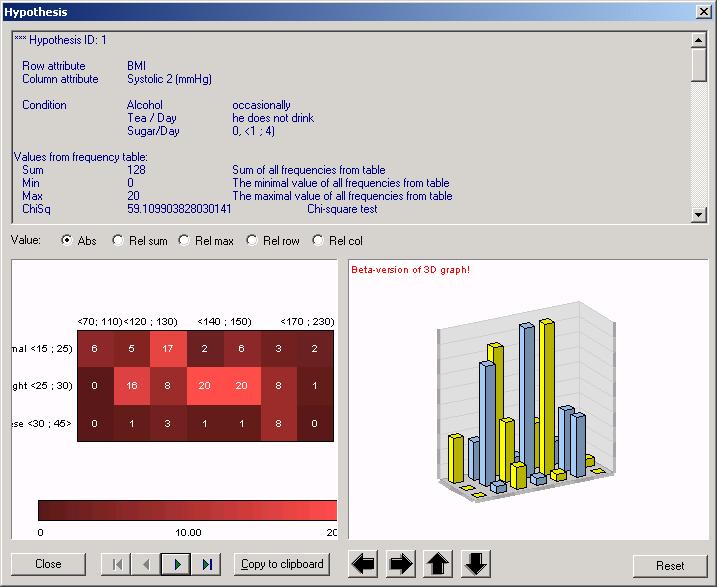
Figure 1: KL-Miner output.
In this particular pattern, we have row attribute BMI and column attribute Systolic blood pressure. BMI has values Normal, Overweight and Obese. Systolic blood pressure has continuous range discretized into seven intervals.
After invoking KL-Collaps, we see the initial screen and set parameters as in Figure 2.
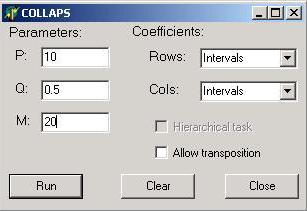
Figure 2: KL-Collaps parameters.
Both analyzed attributes (BMI and Systolic blood pressure) are ordinal, therefore we set the coefficients to be intervals. Further coefficient types available are subsets, cuts, left cuts and right cuts, they have the same meaning as in 4ft-Miner. The three numeric parameters have the following meaning.
After running KL-Collaps, we see the output window as in Figure 3.
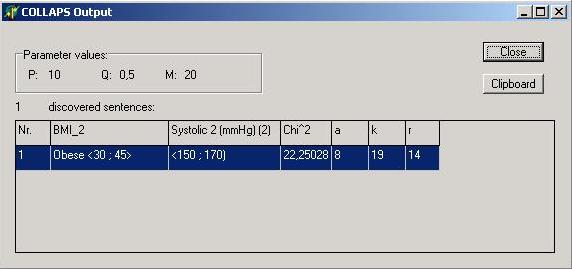
Figure 3: KL-Collaps output.
We see that the strongest interaction conforming to the given parameters is the one between categories BMI=Obese and Systolic pressure = 150 to 170. We can copy the output to the Windows' clipboard. Numbers a, r = a + b, k = a+ c are computed from the corresponding 2 * 2 table (see below).
By double clicking the highlighted pattern, we view the corresponding 2 * 2 table and further details, as in Figure 4.
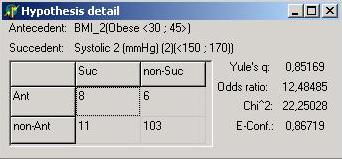
Figure 4: KL-Collaps output detail.
The additional statistics that we see are
![]()
![]()
Main menu:
Send comments about this site to the webmaster