◤Demonstration – DataSource◢
Main menu:
On this page you will find usefull information, how to use DataSource module. This module is one of several modules of the LISp-Miner tool for knowledge discovery in databases (KDD, data mining).
The DataSource module (LMDataSource.exe file) is to:
In this demonstration we assume we have created ODBC datasource “LMexample” as we have created it in how to start.
Start the LMDataSource.exe file. In the window LISp-Miner working database select our LMexample.mdb Metabase and click on the Select button. Now, you got main window of the LMDataSource subsystem (KDD procedure). There is very simple trivial data exploration when you click on Frequencies (or Rows, Columns) button. But our goal is to mine for association rules, so we must use LMDataSource as a tool for attribute creation.
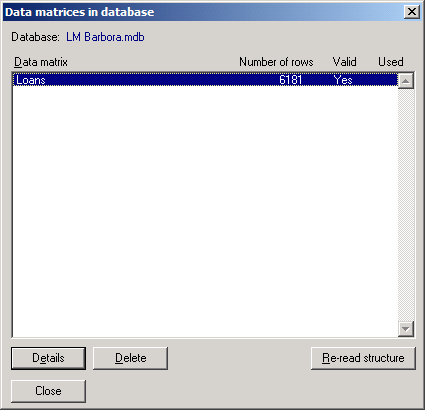
Select Database|DataMatrices in the main menu (or use F5 key). You get this window:
Select Detail button. Now, we mark primary key of the Loan data matrix: click on the row loan_id and then click on the Primary key button – primary key is marked:
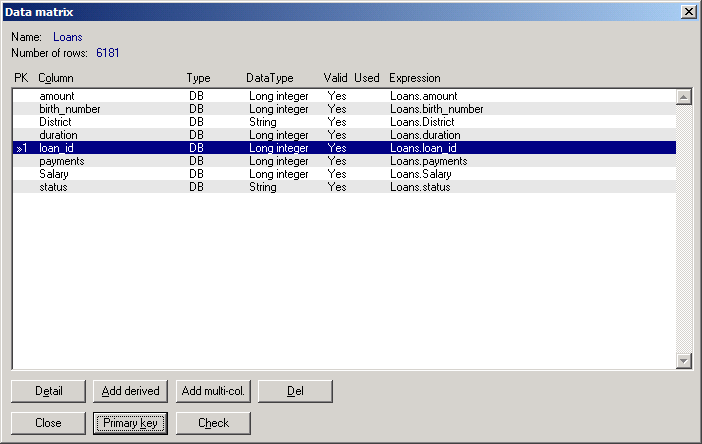
Select Check button and confirm the check of the primary key for duplicites. If the check is OK, you can go on. (It is necessary to mark primary key and check it for duplicites before you start tho process of attribute preparing. The primary key can be composed of one or more data columns.) Close both Data matrix and Data matrices in database windows.
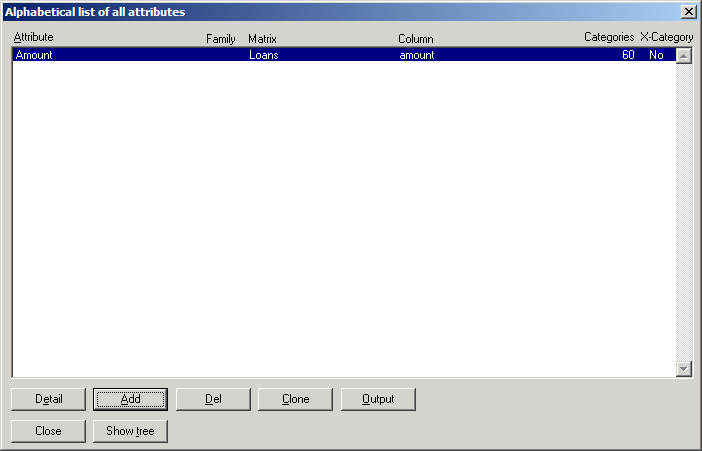
Select Database|Attributes list in the main menu (or use Ctrl+F7 key combination). You get window Alphabetical list of all attributes:

Select Add button. You get Select a data matrix… window: Click on Select button. You get window Data matrix:
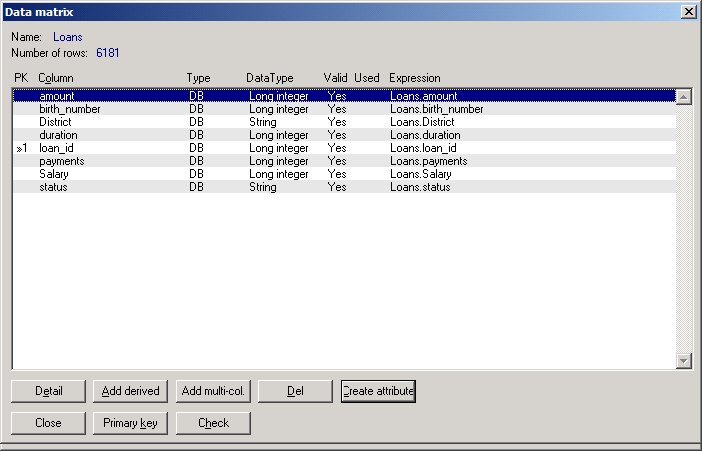
Select first row – “amount” column and then click on Create attribute button. You get Attribute definition window:
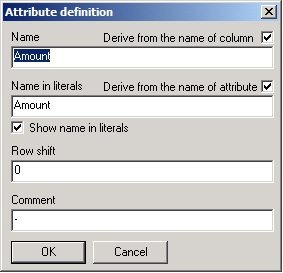
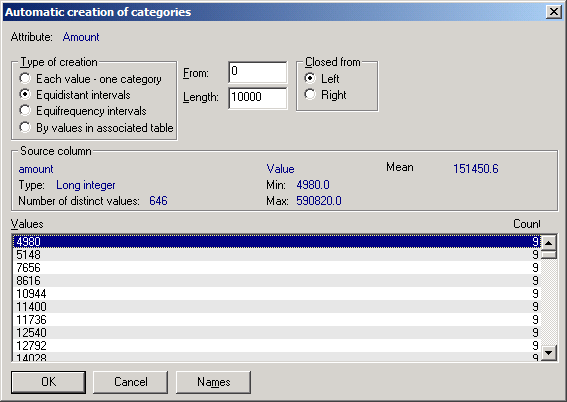
Confirm this Attribute definition by OK button. You get Automatic creation of attributes window:

It seems to be reasonable to create equidistant intervals of values of “amount”: intervals from 0, length of intervals 10 000:
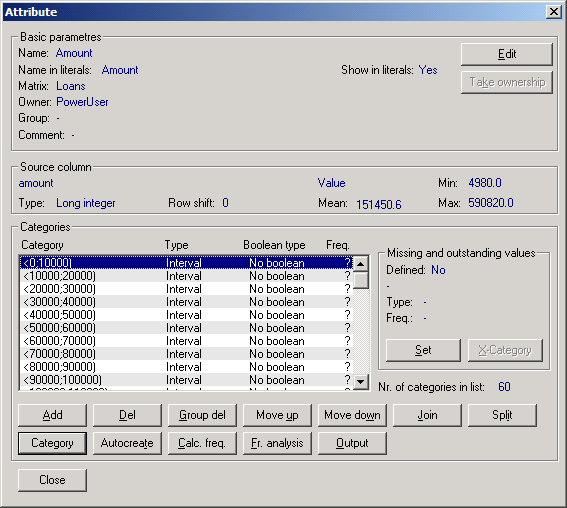
Confirm this creation of the attribute “amount” by OK button. You get attribute window:
Select Fr. analysis button:
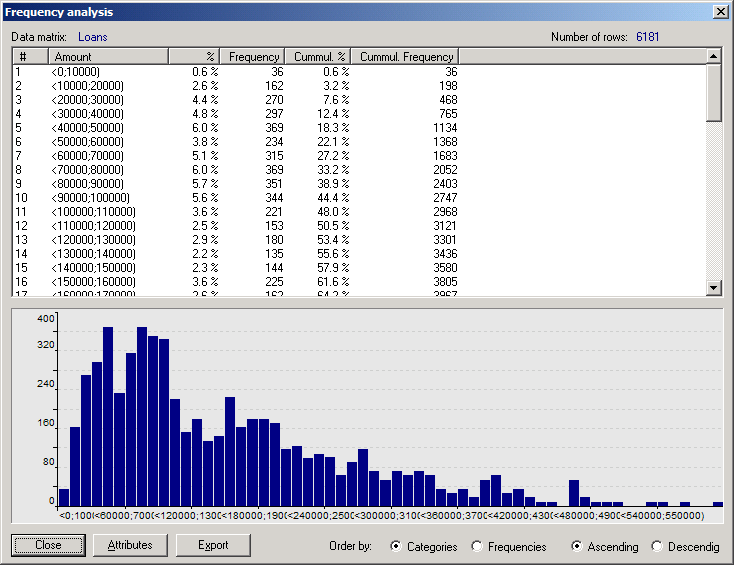
Now you can close the window Frequency analysis. You created first attribute. Close the window, see the alphabetical list of attributes:
Select Add button. You get Select a data matrix… window: Click on Select button. You get window Data matrix. Click on “Distric” and then click on Create attribute button. You get Attribute definition window:
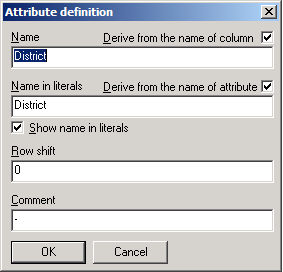
Confirm this attribute definition by OK button. You get Automatic creation of categories window:
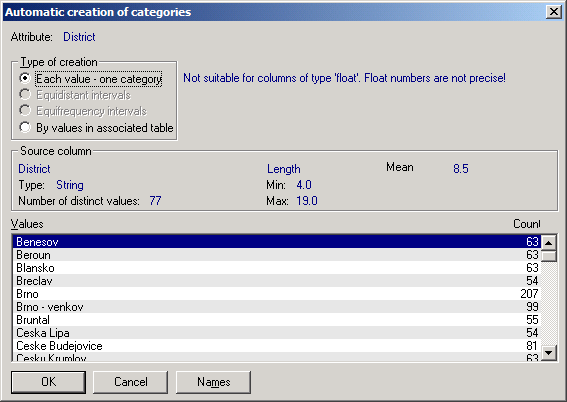
It is reasonable to confirm this creation of categories by OK button. You get Attribute window:
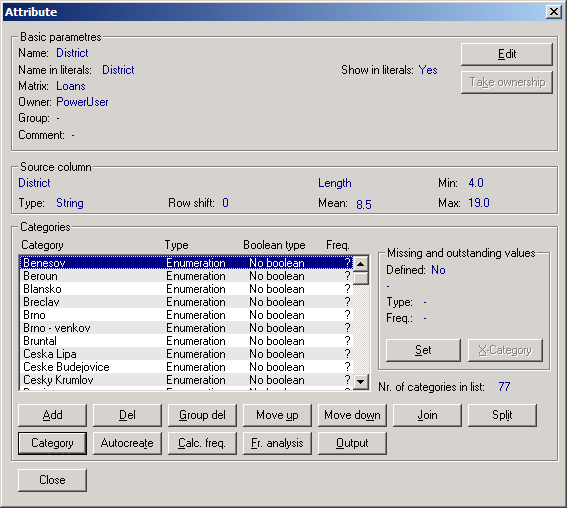
Click on Fr. analysis button to get the frequency analysis:
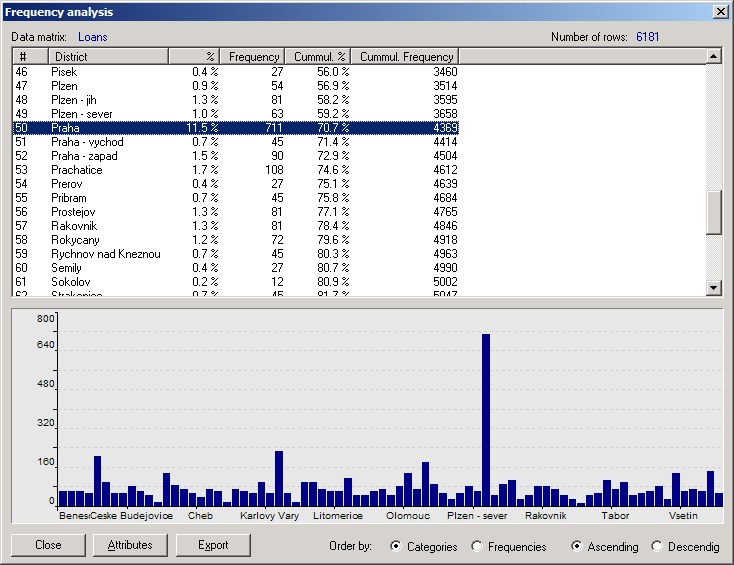
Close the Attribute window. We have created two attributes ” Amount and District.
Select Add button. You get Select a data matrix… window: Click on Select button. You get window Data matrix. Click on “Duration” and then click on Create attribute button. You get Attribute definition window. Confirm this attribute definition by OK button. You get Automatic creation of categories window. It is reasonable to confirm this creation of categories by OK button. You get Attribute window. As category 12 means, that certain loans should hold 12 months, etc. it could be reasonable to join “12” and “13” categories. Mark both “12” and “13” categories and click on Join button. Close Attribute window.
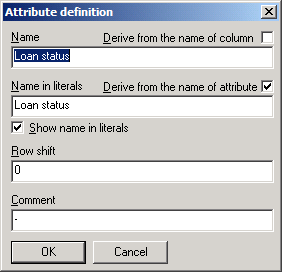
Now we continue by creating fourth attribute. Select Add button. You get Select a data matrix… window: Click on Select button. You get window Data matrix. Click on “Status” and then click on Create attribute button. You get Attribute definition window. You can change the name of the attribute:
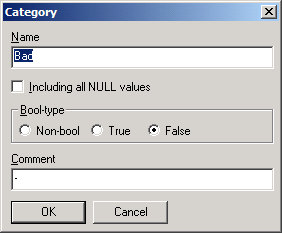
Confirm this attribute definition by OK button. You get Automatic creation of categories window. Confirm “Each value – one category” creation by OK button. You get Attribute window. As categories “B” and “D” means, that ceratin loan is bad, it is reasonable to join these categories: mark both “B” and “D” and click on Join button. Then click on the new join-category. Then click on Category button, you get window Category – enumeration of selected categories. Then click on Edit button and change the name and mark Bool-type as false:
Close window Category, you get back the window Category – enumeration of selected categories:

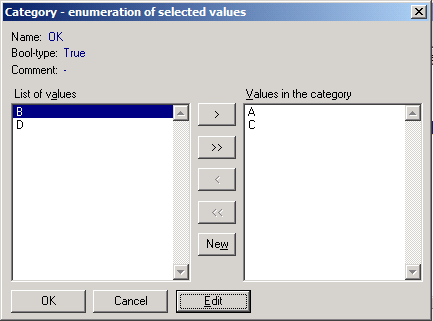
Now mark both “A” and “C” categories and then click on Category button. Then click on Edit button and change name of the category: OK and mark Bool-type as true. Then click on OK button, you get window:
Click on OK button, you get window Attribute:
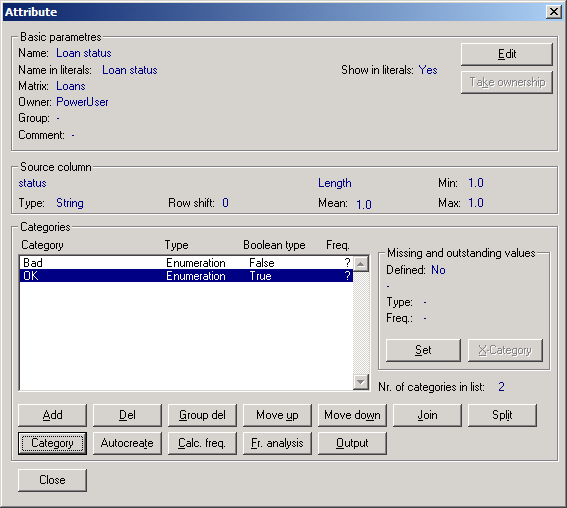
You can watch frequecy analysis by clicking on Fr. analysis button (finish it by Close button). Close the window Attribute by Close button.
Select Analysis in the main menu to get several simple data exploration (analysis):
There are Columns, Rows, Frequencie buttons on the main window. Use these buttons to do simple data browsing.
![]()
![]()
Main menu:
Send comments about this site to the webmaster